
Cromlaview Software
CROMLAVIEW® software; CR-Tool and CromlaWatch
Appropriate software for each application
The free standard software CR-Tool, which ASTECH provides with all color sensors, facilitates parameterization of the CROMLAVIEW® color sensors. Besides setting the parameters of the sensor, the taught-in color values can be displayed in a graph and a table.
The software CromlaWatch is used for the documentation of color values in ongoing processes, such as color monitoring of moving belts or monitoring of the color of sewage. It displays the course of color changes, which is documented and can then be saved in files.
CR-Tool
|
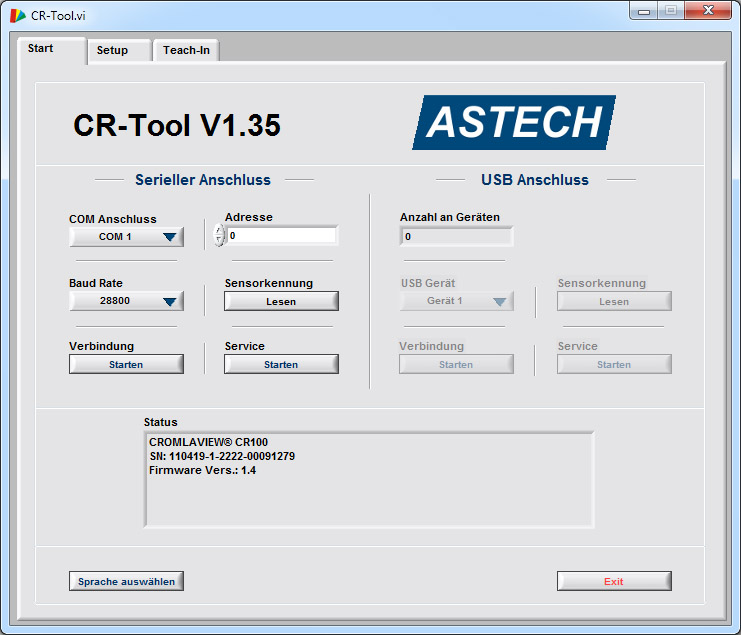
On the start screen of the CR-Tool you can select the connection to the PC via RS232 (on the left) or USB (on the right). Baud rate, sensor address and COM connection can be adjusted with an RS232 connection. For the USB connection you can select the appropriate device. For both types of connection, the sensor identification, which contains the serial number and the type of the CROMLAVIEW® color sensor, can be read out. Furthermore, the current firmware of the device is displayed. |
|
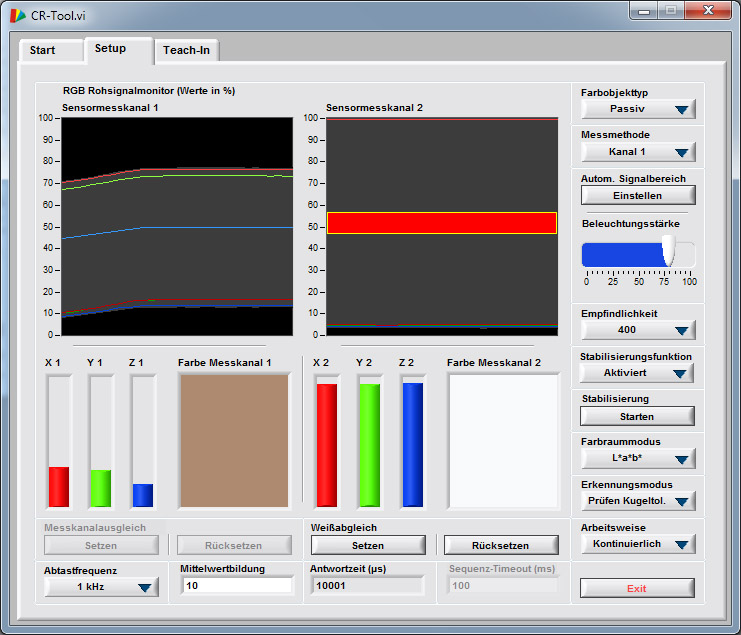
The setup screen displays the input signals of the three channel color sensors for both color channels, so that reasonable settings are possible. On this screen you can set illumination intensity, input amplification, measuring frequency and averaging as well as the color space mode. In addition to that, you can set white balance and, for the two channel color sensor CR 200, inter-channel balance. |
|
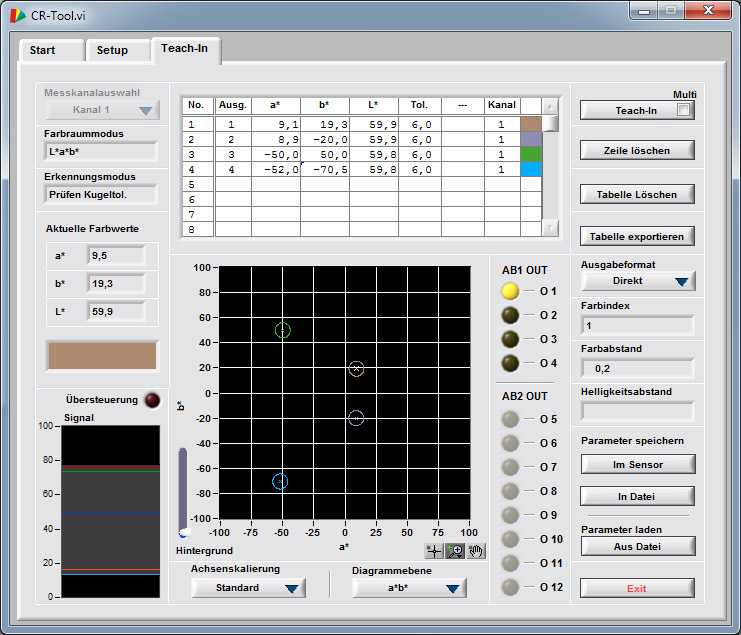
On the teach-in screen you can teach in and display colors. The multi-teach process allows for the determination of averaged color values of several samples. The taught-in colors are shown in both, a table and a diagram. Besides that, the states of the switching outputs of the color sensor are visualized. Another display shows the distance between the currently measured color and the recognized color value. The sensor parameters can be stored in the memory of the sensor and in a file as well. Export of the color table into an Excel-compatible .csv file is also possible in this window. |
CromlaWatch

|
CromlaWatch records color values with sample rates from 0.1 s. They are displayed either component-wise (L*a*b*) or with the color distance in ΔE. The desired color can be recorded and set per color component or as a tolerance for the total deviation. The tolerance is displayed as a tolerance range in a diagram. If one component of a color leaves this range, the relevant field is highlighted in red. Exceeding the tolerance range is shown in the diagram. For documentation purposes the data can be exported in an Excel-compatible .csv file. As the sample rate can be very different, the time per data file can be set between 5 minutes and 1 day. |
Contact
Dr. Gundolf Geske
+49(0)381/44073-17
+49(0)381/44073-20
This email address is being protected from spambots. You need JavaScript enabled to view it.
